
Stronger, Longer, Slower: Why Some Markets Just Keep Trending
Do slower production cycles lead to stronger trends?

In early 2024, cocoa prices exploded. Headlines pointed to speculation, hedge funds, even chocolate hoarders. But the deeper story wasn’t only about Wall Street — it was about West Africa, diseased cocoa trees, and a supply chain that simply couldn't bend.
Beneath the noise, one of our investors raised an interesting question:
Do slower-growing agricultural markets — like cocoa, coffee, or cattle — trend longer than fast-growing crops like corn or soybeans?
The theory made intuitive sense. In markets where production responds slowly — whether due to biology, investment cycles, or policy — prices should continue trending longer in response to demand shocks, simply because supply can’t adjust quickly.
Meanwhile, grains and oilseeds — fast-growing, replanted annually — are more likely to revert quickly, with prices oscillating around fundamentals.
We set out to test this idea — combining smoothed price data and trader positioning (via COT reports) across 18 markets — to understand what really drives trend persistence.
Grouping the Markets
We classified 18 futures markets into two broad groups based on biological and logistical production speed:
Fast: Corn, Soybeans, Wheat, Oats, Rice — replanted annually with flexible production.
Slow: Cocoa, Coffee, and Orange Juice, Milk, Live Cattle, Lean Hogs — including perennial tree crops, dairy, and livestock.
In other words, the "Slow" group includes not just tree-based crops but also animal-based markets with inherent production lags due to breeding, feeding, and maturation time. These supply chains are less flexible and less responsive to price shocks.
What the Literature Tells Us
Supply Inelasticity & Production Lag
Markets with long biological or logistical cycles (tree crops, livestock) can’t adjust supply quickly.
This leads to persistent price trends, especially after shocks.
Reference: Gilbert (2010), "How to understand high food prices."
“Slow biological production cycles amplify supply-side rigidity, inducing trend persistence in prices.
Storage & Speculation Effects
Non-perishable commodities (like grains) often have futures curves and inventories that absorb price shocks.
Perishable or slow-growing crops can’t be stored well, so price moves tend to persist.
Reference: Wright (2011), “The Economics of Grain Price Volatility”.
“When storage is not viable, prices reflect a sequence of shocks rather than reverting.”
Market Microstructure
Thin, less liquid markets (often true for livestock and tropical softs) may show stronger trend-following behavior due to:
Less frequent rebalancing
Fewer arbitrage opportunities
More retail/small fund participation
Reference: Fung & Hsieh (2001), "The risk in hedge fund strategies."
Trend Following and Behavioral Finance
Commodities with less transparency or fewer substitutes (common in slow crops) are more prone to herding, which supports prolonged price trends.
Reference: De Long et al. (1990), “Positive feedback investment strategies and destabilizing rational speculation.”
Summarized, empirical studies often support greater trend strength and persistence in:
Commodities with long planting-to-harvest cycles
Thinly traded futures
Less-developed producer regions (where shocks propagate more slowly)
But production biology isn’t the whole story. Market microstructure and behavioral dynamics also shape how trends emerge and persist — from liquidity constraints to herd-like trading behavior.
Yet few studies bridge these dimensions: biological rigidity, speculative flows, and trend persistence.
To connect them, we turn to the Commitment of Traders (COT) data — a long-standing tool for understanding market behavior.
Using COT Data to Detect Trend Drivers
To distinguish between speculative and fundamental price trends, we relied on Commitments of Traders (COT) data. COT reports, published weekly by the CFTC, break down open futures positions into:
Commercials (hedgers) — producers or processors hedging physical exposure
Large Speculators — institutions, funds, trend-followers
Small Traders — typically retail
While COT data is widely used by analysts and funds, we use it here not just as a sentiment gauge, but as a way to classify the driver of each price trend.
We calculated a COT Index as a percentile rank of net positions (speculators and commercials separately) over a 156-week window. If speculator net positions were in the top 20% of their historical range, the trend was tagged "speculative." If they were in the bottom 20%, the trend was tagged "fundamental." Our results remained consistent for various window length, ranging from 26 to 156 weeks.
While we also considered classifying trends based on extreme commercial positioning, this approach proved less informative. Commercials often hedge against price direction, and their positioning is shaped more by risk exposure and inventory needs than speculative conviction. As a result, extreme commercial COT readings rarely aligned consistently with the onset of durable price trends.
We smoothed price series using exponential moving averages (EWMA) to identify persistent price trends.

For each trend we measured:
Length = number of weeks in a directional move
Strength = cumulative return over the trend
Weighted Strength = return × duration
Each trend was matched with COT data to assign a sentiment label at the start or averaged across its duration
We analyzed smoothed weekly price trends across 18 commodity markets — including grains, livestock, dairy, and tropical crops — and ran regressions to test how trend length and trend strength relate to market type (Fast vs. Slow), trend direction (Up vs. Down), and trader positioning (using COT data).
Key Findings
1. Uptrends are stronger — but shorter
Across both fast and slow markets, uptrends produced higher average returns than downtrends.
However, they also faded more quickly, lasting fewer weeks on average.
Uptrends = sharp and strong
Downtrends = slower but longer-lasting
2. Slow markets trend stronger — and longer when fundamentals dominate
Markets in the Slow group (livestock, tree crops, milk) exhibited higher average trend strength and longer trend durations, particularly during non-speculative trends.
This supports the view that supply-side rigidity reinforces price persistence, especially when trends are driven by fundamental shocks.
3. Speculative trends are shorter-lived
Trends classified as speculative (based on extreme COT index readings) were typically shorter in duration.
These trends were often more intense, but less persistent — consistent with faster capital flows and rapid reversals.
Note: These findings are based on regression models of log-transformed trend length and strength and were statistically significant. All trends were detected using smoothed EWMA price series, and classified using trader positioning data from the CFTC Commitments of Traders reports.
Case Studies: Three Commodities, Three Behaviors
To explore how different market structures affect trend dynamics, we examine three representative examples:

How to Read This Chart
This chart shows the daily futures price of a commodity alongside trader positioning data from the Commitments of Traders (COT) report. It helps visualize how speculative and commercial behavior aligns with price moves.
Black line (left axis): The price of the generic front month commodity future (e.g., Cocoa, Soybeans, Rough Rice), shown on the left axis.
Blue Line (right axis) – Large Speculators' COT Index
A normalized measure of net positions by large speculators over a 156-week window.Calculated as (simplified):
\( \text{COT}_{Index} = \frac{\text{CurrentNetPosition} - \text{Min}}{\text{Max} - \text{Min}} \times 100 \)
over the 156-week period.Values near 100 = historically high speculative long positioning
Values near 0 = historically low (or short) positioning
Green dashed line (right axis): The Commercials' COT Index (156-week normalized measure of net positions by commercials).
Reflects how hedgers (e.g., producers, processors) are positioned relative to their own history.
Rising values often suggest commercial buying or hedging activity.
Shaded red areas: Periods where speculator COT Index > 80, indicating speculative extremes that often precede or coincide with major price shifts.
This chart format is used throughout the article to compare different commodities and their underlying drivers.
Cocoa – When Fundamentals Take Over a Speculative Trend
Cocoa futures surged from ~$2,500 to over $12,000/ton between late 2023 and early 2025, before correcting to ~$8,500. In most of the media, speculators were painted as the culprit behind the price surge. However, was this only a speculative bubble?
Not exactly.
Speculative pressure (Speculative COT Index) peaked early, but as the trend intensified, speculative positions decreased. Meanwhile, commercial positioning rose steadily, reflecting tight supply and long-term demand hedging.
This aligns with:
Structural production issues in Ghana and Ivory Coast
Slow-growing trees and disease outbreaks (e.g., black pod and swollen shoot)
Fixed producer pricing in Ghana and Ivory Coast limited farmer response
This illustrates how a trend may appear speculative early but be sustained by fundamental constraints long term.
Soybeans – Replantable, Multi-Cycle Moves
The soybean trend between Q3 2020 and Q2 2021 tells a different story — one that fits well with the dynamics of faster-growing, more elastic crops.

Prices surged in late 2020, driven by a combination of:
Strong post-COVID Chinese demand
Dry weather in South America
Low U.S. inventories
The Speculative COT Index spiked early, indicating trend-following flows entered aggressively.
But as the trend matured, we observed:
A rise in the Commercial COT Index in Q1–Q2 2021, as farmers and merchants began hedging against higher prices.
USDA data began showing increased acreage as producers responded to the price signal.
Soybean prices pulled back, reflecting this coming supply response.
Then in Q1 2022, prices surged again — not from speculative pressure, but in response to:
New drought conditions in South America
Geopolitical instability, especially the Russia–Ukraine war, which disrupted grain flows and increased oilseed demand globally
Unlike cocoa, soybeans are replanted annually and mature in ~90–150 days. They are grown across both hemispheres — with a biannual harvest cadence: U.S. harvests in Q4, Brazil and Argentina in Q1–Q2.
This allows soybean supply to adjust quickly and smooth out extreme imbalances, making trends more reflexive — rising sharply on shocks, correcting as supply responds, and surging again with fresh catalysts.
Rough Rice – Erratic and Fast
Rough rice sits on the opposite end of the trend spectrum. With a short biological cycle (~100–120 days), supply can ramp up quickly. But the U.S. rice futures market is thinly traded, which contributes to sharp, unsustained speculative moves.
Unlike soybeans, global rice harvests are irregular and region-specific, often with multiple cropping cycles in Asia, but no clean overlap. Global rice supply/demand imbalances — especially from India, Vietnam, Thailand, or China — impact global rice prices, which in turn affect U.S. export competitiveness and thus U.S. futures. The result is a market that’s biologically fast but structurally fragmented.
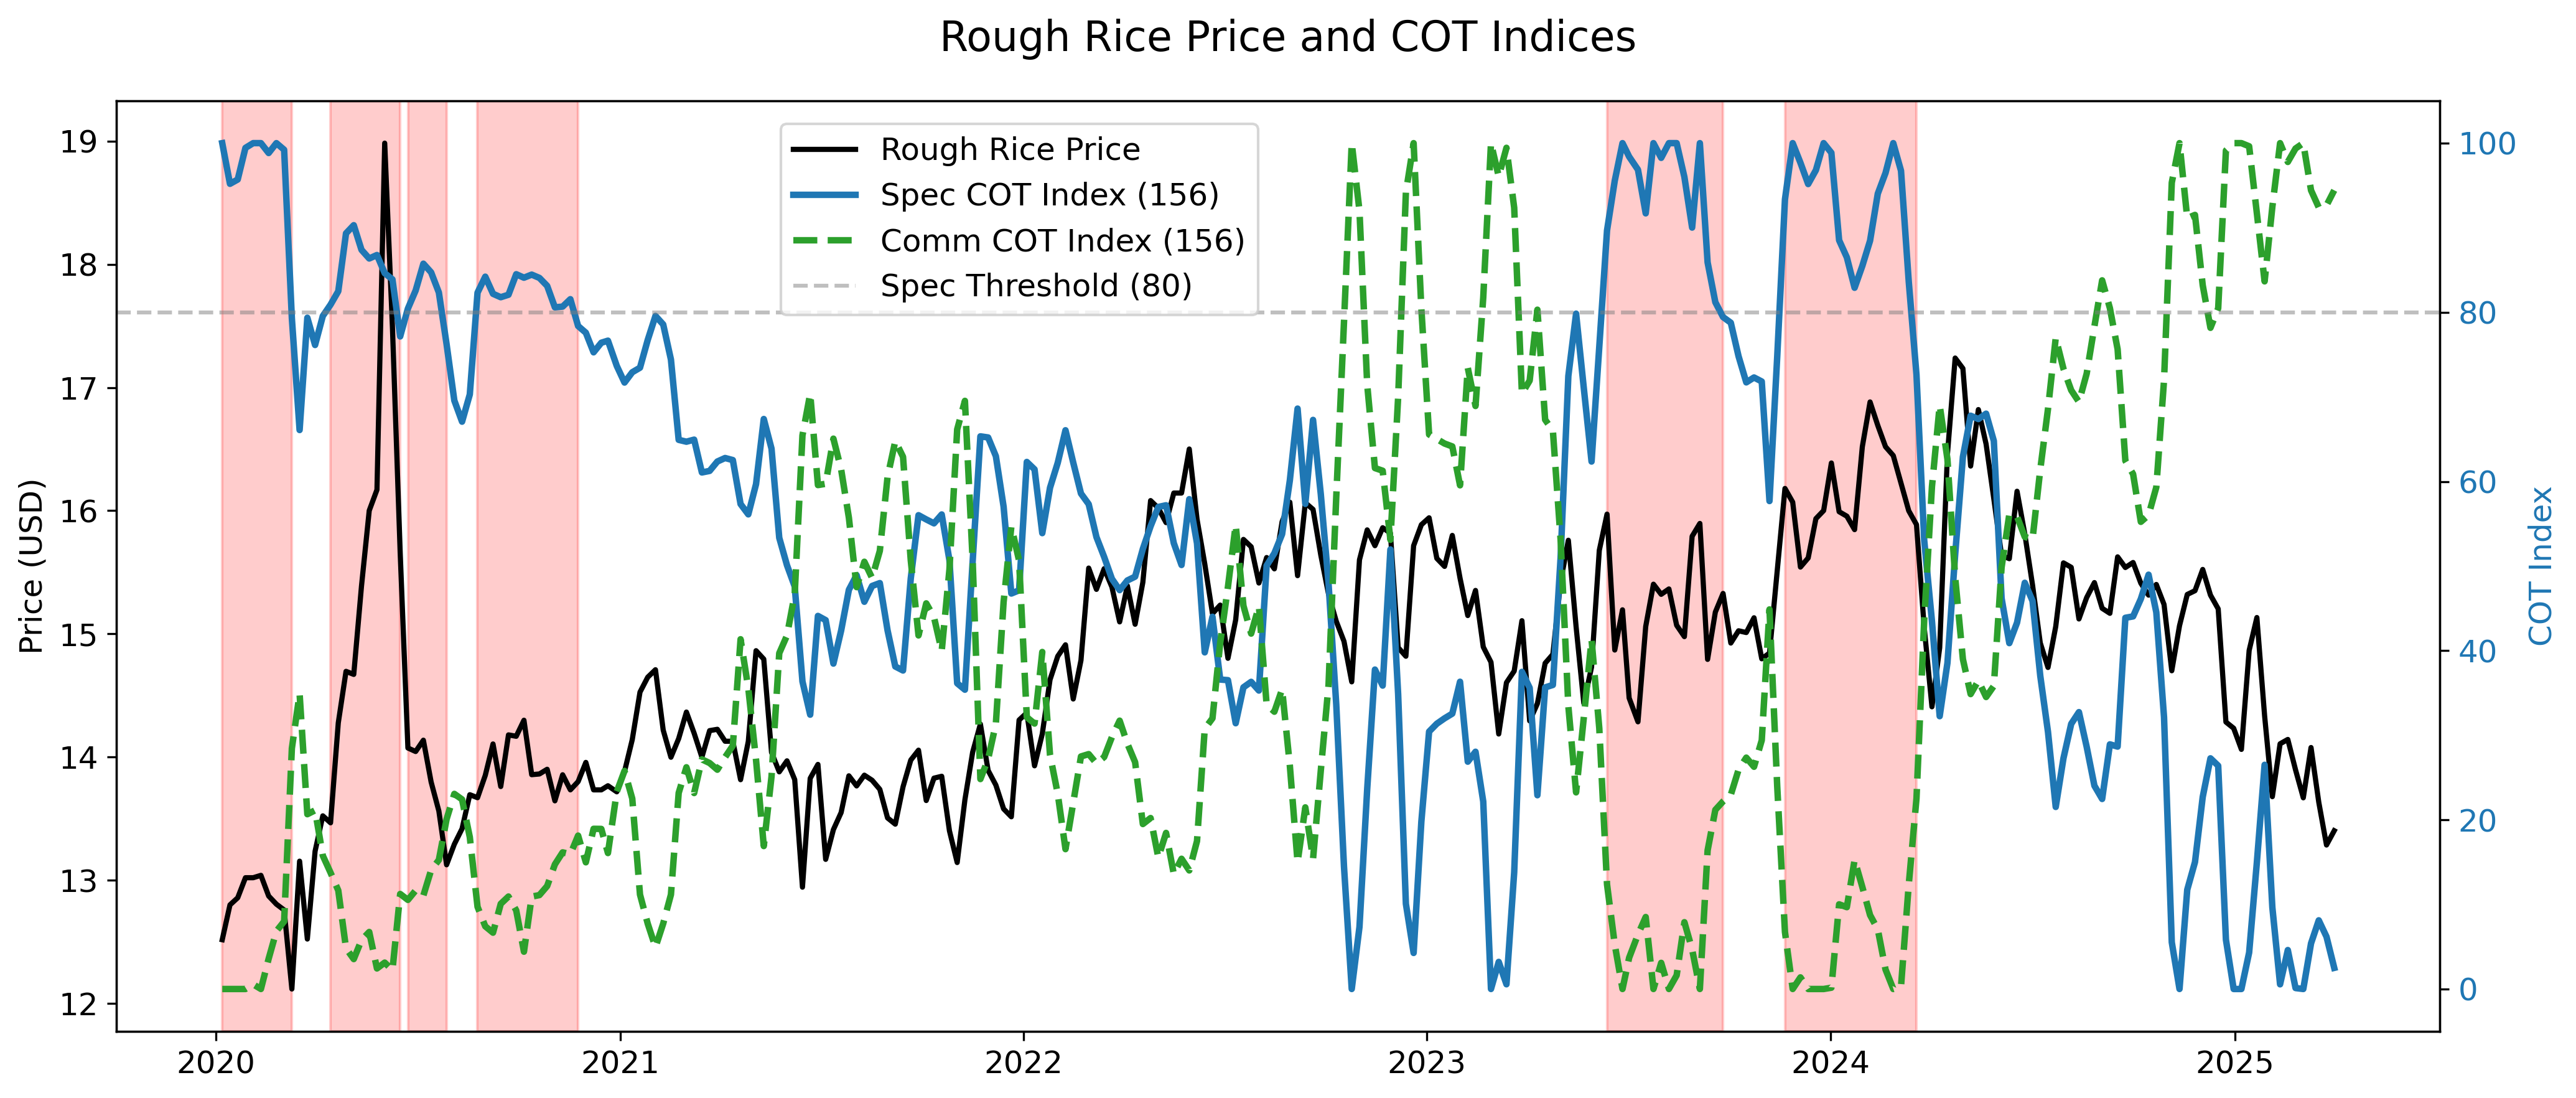
In early 2020, prices spiked due to COVID-era stockpiling and droughts in key Asian export regions — but the rally quickly reversed. Similar speculative surges occurred in late 2023 and early 2024, coinciding with strong U.S. exports, yet again failed to sustain momentum.
Since mid-2024, however, the picture has shifted: the downtrend in rough rice appears fundamentally driven, with speculators aligned bearishly and commercial positioning rising — a sign of hedging amid global oversupply, record production, and intensified export competition.
Rough rice reflects a market with fast-growing supply, low liquidity, and reactive positioning — a recipe for brief surges, followed by rapid reversals. Still, recent structural shifts may indicate the beginning of a more sustained realignment.
Final Thoughts
This analysis began with a simple question:
Do slower biological or logistical production cycles shape how long and how strongly markets trend?
The answer — supported by both data and theory — appears to be yes.
Markets with sluggish supply responses, like cocoa or live cattle, exhibit longer-lasting trends, especially when not accompanied by speculative extremes.
In contrast, speculation fuels shorter, sharper price movements — flashes of momentum that often fade just as quickly.
By combining smoothed price trends with COT positioning, we can begin to tease apart the drivers behind these trends:
Are we witnessing a structural imbalance?
Or just a speculative push?
Cocoa’s recent rally offers one vivid example — but the same mechanics may be playing out in dozens of other markets, from orange juice to live hogs.
As always in commodities, biology meets behavior.
And next time markets move sharply, ask yourself:
Is this a speculative ripple — or the start of a trend supply can’t stop?
That answer may tell you whether the trend is noise — or just getting started.
Happy Trading!
Great article! Quick question on the COT data? Can one effectively use this data for signal generation? Wondering cause I think they may be prone to revisions?
Fascinating! The cocoa vs soybeans comparison really drives home the thesis of supply rigidity contributing to persistent trends. Makes you wonder what other 'slow' markets are setting up for multi-year moves that speculators may be missing. Is this the start of 'biology beats behavior' economics? 🌱📈