
Opening the Box of Macro Trend
What Schrödinger Can Tell Us About Tomorrow

Nothing here is investment advice. Past performance ≠ future results. This post is for research and education only.
Long time no post. One reason is the mandatory six weeks summer vacation we Europeans absolutely, definitely take every year. The other reason is this: we have been cooking. At the same time our Global Markets fund at Takahē Capital has kept us more than busy. It had a great start since launch and demanded a lot of attention, which explains the silence here.
On top of that, we spend a good part of our days answering questions, not only about the fund or pure trend following, but also about markets in general. Friends, investors, even casual contacts want to know: what do you think about crypto, about equities, about the economy? Often these questions go far beyond our strict trend systems.
Since I run systematic trend strategies for a living. My default answer to “What do you think about X?” has always been: computer says up/down. Buy strength, sell weakness, size the risk, repeat. It works, but it is also exactly what most people don’t want to hear. They want a view.
What if we could have a view without abandoning discipline? That is what led me to a macro trend project I have been building quietly for a while, now christened Schrödinger’s.ai (X.com/schroedingersai).
Why now: AQR lit the fuse
A week ago I posted a chart on X and LinkedIn showing historical analogues to today’s market state. I feared the wrath of trend following purists, but the response was positive. One follower even pointed me to two excellent AQR papers:
Economic Trend (Brooks, Feilbogen, Ooi, Akant)
A Half Century of Macro Momentum (Brooks)
These show that simple, rules based macro signals (think: improving growth → good for equities) can be traded systematically across assets, with low correlation to classic price trend. The idea is intuitive, transparent, and it works surprisingly well in their data.
However, writing a pre-defined rule book seems out of my depth. As a quant, I would rather let the data speak and embrace the flexibility of strong convictions, loosely held. Things change, even in the macro world.
Schrödinger’s.ai borrows the spirit but not the rulebook. Instead of a fixed decision matrix ("if CPI does this, then buy that"), we ask a simpler question:
When markets looked like this in the past, what tended to happen next?
That is analogue based self similarity in a sentence.
My background: empirical similarity and CBDT
Over a decade ago I published research on Empirical Similarity (ES) and Google Trends, an offshoot of Case Based Decision Theory (CBDT). CBDT was introduced in the 1990s by Gilboa & Schmeidler as a model of decision making under uncertainty. Instead of relying on subjective probabilities, CBDT posits that people recall past situations that look similar to today’s and judge actions based on how well they worked back then.
In other words: do not guess the future, compare with the past.
ES adapts this principle to data. At each evaluation point, we represent a market with a set of features: price dynamics, volatility, drawdowns, and macro changes (unemployment, term spread, CPI, industrial production, etc.). If today looks statistically similar to some past cluster of weeks, that fact alone carries information. In finance, where regimes shift and models decay, this parsimony is a strength. Where many machine learning models try to generalize from millions of samples, ES is content with “eyeballing” the closest cases.
That background naturally connects to today’s analogue engine.
The analogue engine
1) Describe today’s state. Each week we encode the market with a feature vector: recent price and volatility, plus macro shifts.
2) Find look alikes. We compare today with history and select the most similar past weeks (analogues), weighted by closeness.
3) Ask what happened next. For each analogue we look 4, 8, and 12 weeks forward. That produces conditional forward paths and return distributions.
4) Blend and gate. We combine the evidence across horizons into a directional view and measure of confidence. If the analogue sample is strong, consistent, and sufficiently positive (or negative), the signal is classified as Alive. Otherwise, it is Dead.
Schrödinger’s cat
Schrödinger’s famous thought experiment puts a cat in a box with a random trigger: until observed, the cat is in a superposition of Alive and Dead.
Markets are not that different:
Before we run the analogue test, a market is in a superposition of possible outcomes.
Running the analogue analysis is like opening the box: the superposition collapses into either an Alive or Dead state.
Alive → the historical evidence is strong enough to justify taking risk.
Many close analogues exist.
The majority led to gains in the following 4–12 weeks.
The expected forward move is meaningfully positive (or negative, if we allow shorts).
Dead → the evidence is too weak, inconsistent, or sparse to act on.
Too few analogues, or
Forward returns were all over the place.
But here is the twist: just like Schrödinger’s paradox, sometimes a market is both Dead and Alive. The evidence might be right on the edge. Some analogues point clearly up, others clearly down. In that case, the cat is in limbo. The model flags the setup as indeterminate, reminding us that sometimes the smartest decision is to wait.
That gives the Alive/Dead metaphor more depth:
Alive = strong historical precedent → take the trade.
Dead = inconclusive precedent → stay flat.
Alive & Dead = conflicting precedent → uncertainty acknowledged.
Alongside the idea, a fitting logo was born: Schrödinger’s Cat (or just Schrödinger), mascot of our new model.

How it looks in practice
Take the S&P 500 as an example. Each Friday close we look at historical analogues and summarize them in our macro map.
At the top, you see the current path of the S&P 500 from 52 weeks ago until today (in blue). Next to it, the estimated path for the following 52 weeks (grey dashed line) as well as the 20% and 80% confidence bands around that forecast (grey shaded area). Naturally, the further out you go, the wider the bands become.
In the middle, the “macro state map” plots today’s macro snapshot (blue dot) against the most similar historical cases (green dots). Here we can choose two influential macro axes to display, for instance unemployment on the y‑axis and manufacturing employment change on the x‑axis. It becomes visible how today relates to past regimes.
At the bottom, a set of analogue tiles shows the actual price paths of the closest historical episodes, all rebased to today. This makes it easy to see which analogue led to −12% over the year and which one to +14%.
Some analogues show negative forward returns, others positive. The model weighs them by similarity and horizon. The outcome is a probabilistic, evidence‑driven forward path: Alive, Dead, or somewhere in between.
The green dots in the macro state map are the most similar historical cases. Similarity is driven not only by the macro axes shown, but also by price, volatility, and other features, so exact alignment is not required. One analogue sits very close to today’s numbers, another had higher unemployment and weaker manufacturing employment, while three others showed around 5% unemployment but positive manufacturing growth.
As for Friday’s view on the S&P, the model suggests positive momentum for the next few weeks, followed by a likely reversal. The key drivers today were unemployment and manufacturing employment change, with the 2Y rate change close behind. The most similar regimes again came from 2021, aligning with unemployment but diverging from today’s negative manufacturing trend.
Most of these analogues being from 2021 is noteworthy. Back then, the world was navigating the post-pandemic recovery: unemployment had stabilized around 5%, fiscal stimulus was fading, and supply chain frictions were still present. Manufacturing was expanding, not contracting, and rates were beginning to rise as inflation became a concern. That environment produced very mixed equity outcomes, some periods saw rallies on reopening optimism, while others sold off as tightening risks came into focus. It is exactly this divergence that the model captures: similarity in some macro dimensions, but with enough variation to explain both bullish and bearish analogue paths.
Portfolio application
From here, for our macro trend model, we rank a ~100 asset futures universe over time. Assets classified Alive get sized according to strength of analogue evidence. Dead assets are not traded.
The current top Alive tilts (4–12 week horizon) include Bitcoin, Platinum, Silver, Feeder Cattle, FTSE MIB.
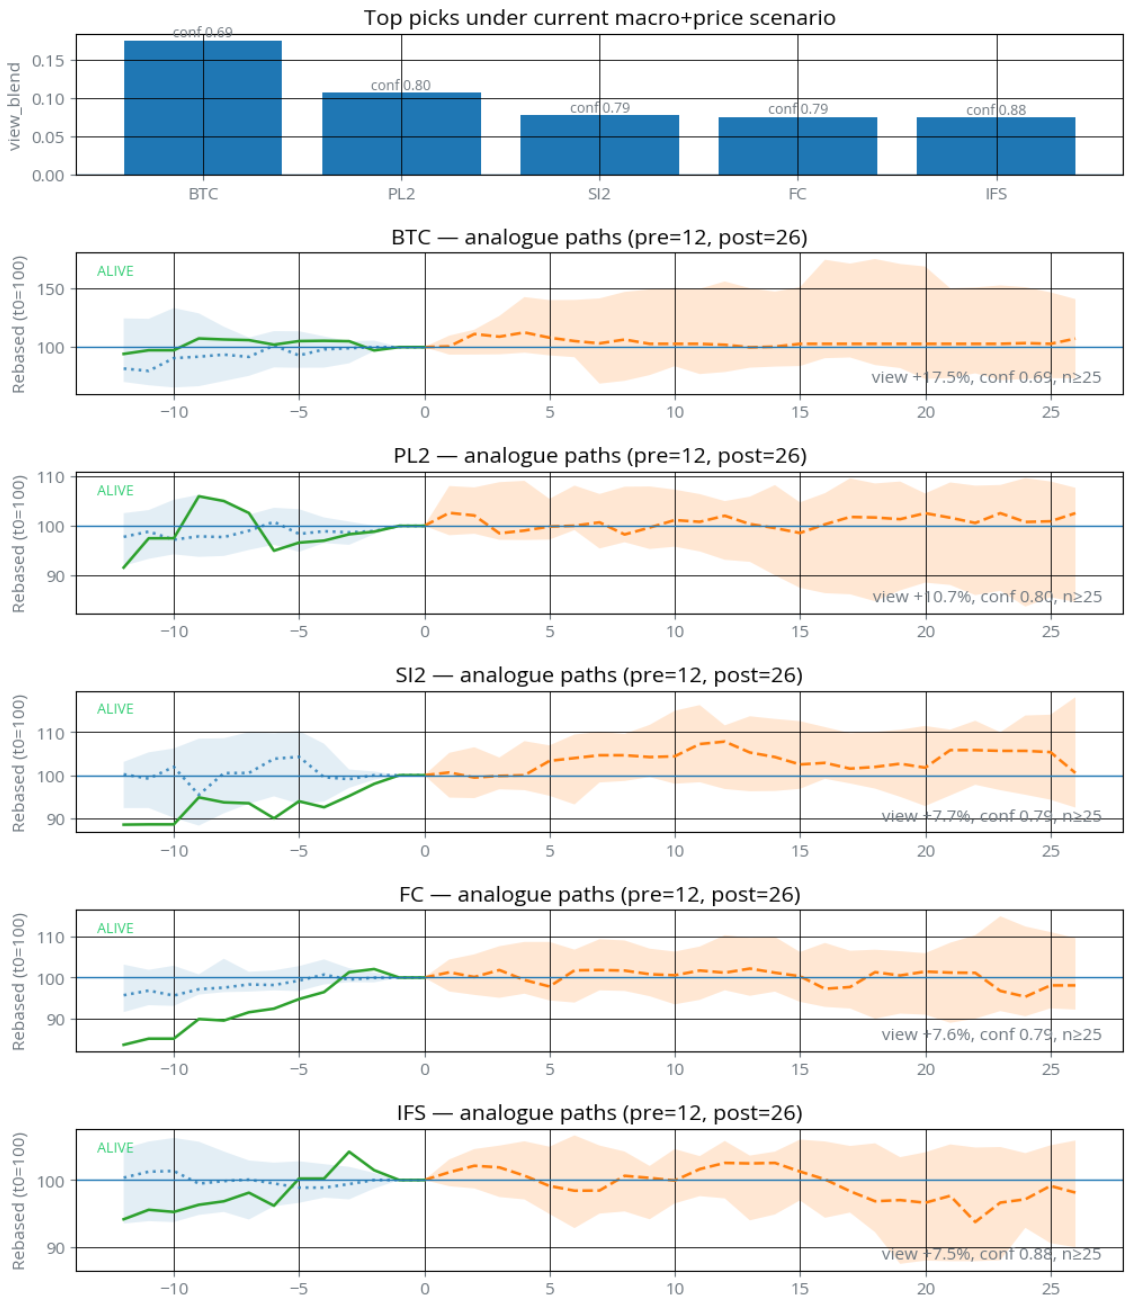
Looking at the most fitting historical analogues allows for some interpretation, both why the model might have picked those scenarios, but also how the future might look like.
Bitcoin → modest up in 4–6 weeks, sideways after, skewed upside; +17.5% median 12 week return. Bitcoin often shows wide confidence bands in analogue analysis. That reflects its higher volatility and regime sensitivity. The asymmetry of upside versus downside bands is what makes the model lean long: in similar past regimes the reward for holding outweighed the drawdowns.
Platinum → near term positive, fades after week 12. Platinum tends to show shorter cycles compared to Gold or Silver. The analogues suggest a tactical window where industrial demand and positioning historically provided support, but also warn that the rallies did not persist beyond three months in similar setups.
Silver → flat for now, trend potential kicking in around week 4; +7.7% median return. Interestingly, the model favors Silver over Gold. One reason could be that the analogues place more weight on industrial and macro-cyclical drivers where Silver behaves differently from Gold. In similar past regimes, Silver tended to respond more positively while Gold either lagged or stayed flat.
FTSE MIB → buoyant for weeks, then downhill after week 15. The Italian market shows up here more often than you might expect. Apparently Schrödinger has a taste for Italian equities, though Prime Minister Meloni might not be amused by the model’s projection of a turn lower after the initial strength.
Results
Before showing numbers, a few words on how the backtest was constructed. The Macro Trend analogue strategy was tested on a universe of around 100 global futures markets, across equities, bonds, commodities, and currencies. Every Friday close was used as a decision point. At each point, the model computed analogue matches based on price dynamics and macro changes (e.g., unemployment, manufacturing employment, CPI, industrial production, 2y yields, term spread, PPI). Forward paths were evaluated at 4, 8, and 12 week horizons. If the analogue evidence passed the Alive thresholds, the asset entered the portfolio. Position sizing followed a volatility targeting scheme to reach around 30–35% annualized vol, comparable to our high octane trend benchmark. Transaction costs and realistic slippage assumptions were deducted.
On this setup, over a 20 year period:
Sharpe ≈ 0.8 (after costs)
Correlation to classic trend ~0.33
Correlation to S&P ~0.2 (classic trend ~ -0.01)
To visualize performance, I will include a log scale chart comparing Macro Trend against two benchmarks:
Takahē Trend Index (our internal breakout based, high octane trend benchmark on the same universe)
S&P 500 Futures
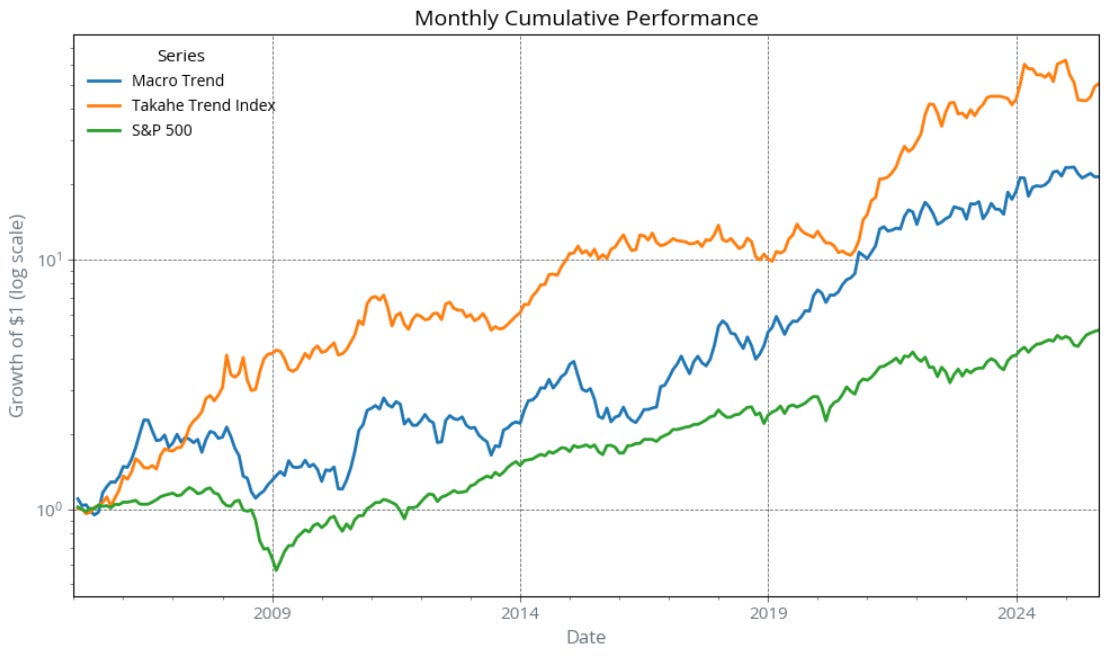
The chart shows that Macro Trend and Trend are both volatile but profitable, and both diversify against equities in distinct ways.
Correlation matrix of returns:
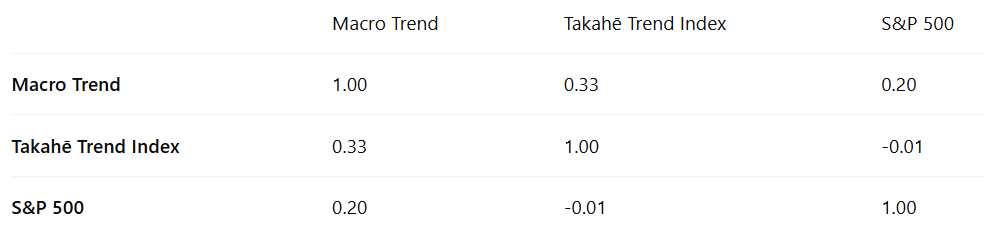
This matrix highlights that while pure trend is basically uncorrelated to equities (slightly negative), Macro Trend has a modest positive correlation to the S&P. That makes intuitive sense: macro variables like growth and employment often rhyme with equity cycles, while pure price trend can happily go short equities when the tape rolls over.
Why this matters for allocation
Combining Macro Trend with a pure price Trend sleeve historically improved diversification. The two signals extract different phenomena: Macro Trend leans into fundamental cycles, while Trend harvests price persistence regardless of macro sign. In portfolios, that mix can smooth the ride without giving up crisis alpha. I will keep the deep dive for a later post and just flag the takeaway here: Macro Trend + Trend appears more resilient than either alone, a point also made in the AQR paper.
What is next: Schrödinger’s Macro Lens
Schrödinger’s Macro Lens will be a weekly ETF-based series so anyone can track along - no futures account required.
Starting with the next post, this space will host a regular series where anyone can follow along with Schrödinger’s AI. To keep it accessible, I will apply the model to a transparent ETF portfolio that captures the main macro themes. That way, readers can easily track how the Alive/Dead calls translate into investable tilts without needing access to a futures account.
Each week you will find:
Analogue fan charts for key markets, showing the range of forward paths.
Macro state maps that position today’s snapshot versus the most similar historical regimes.
Analogue tiles with the price paths of those closest matches.
Alive/Dead roster of ETF picks — the practical outcome of the analysis and a tradeable ETF allocation that follows it.
It is important to keep the limits of the method in mind. The analogue engine gives us a structured, evidence-based way to form views, but it is not a crystal ball.
Confidence bands widen quickly; beyond 12 weeks is more tendency than forecast, not a precise prediction.
History rhymes, does not repeat. Even strong analogues are guides, not guarantees. The Alive gate is meant as a safeguard to avoid acting on noise, not as a promise of accuracy.
I will continue to publish Schrödinger’s macro views here and on X. The ETF sleeve will be introduced in the next post, with decisions each weekend and updates before the US Monday open.
The methodology itself is not limited to macro variables. It can also be extended to sentiment data, commodity-specific fundamentals, or other domains where history provides meaningful analogues.
If you like transparent, testable views and a cat deciding whether a market is Dead, Alive, or both, you will feel right at home.
Further reading:
Jordan Brooks, Noah Feilbogen, Yao Hua Ooi, Adam Akant — Economic Trend (AQR)
Jordan Brooks — A Half Century of Macro Momentum (AQR)
Itzhak Gilboa and David Schmeidler — Case Based Decision Theory (foundations)
P.S. If you are a purist trend follower, do not worry. I have not touched the classic systems. Schrödinger lives alongside them, not instead of them.
Great post, your analysis/view caught my eye as it looked very familiar to some of my own, which is impressive because i use a service for research/education. I found a macro group a while back that pairs Mandelbrot's fractal math and trend following. If your curious about there methods, they have a pdf titled 'master the market'. It is free and just a simple intro to the basics of what they do. It is a rules based risk management approach combining the above, that i have found to be very profitable. https://app.hedgeye.com/
I plan to dive a bit deeper into the work your doing but from what I see, I really like the direction!
Cheers
John
Thanks, John. Much appreciated. I'll check it out!