
Don’t Just Trend It, Curve It
How spread breakouts behave differently

At the time of writing, our Takahē Capital Global Quantitative fund is up 15 days in a row, the longest winning streak we’ve ever recorded. In a difficult year for trend followers, this stretch is a reminder: methodology and strategy diversification matter.
We don’t rely on a single signal type or market. Instead, we layer outright trend, spread dislocations, and short-term momentum across global markets. Those layers may behave very differently.
After being quoted in EQ Derivatives and posting on LinkedIn recently, we’ve received a number of questions about how our spread trend systems work. This article answers those questions using a current example: copper — a market where recent curve rotation made a spread breakout particularly visible.
Spread Trends: Different Lifespans, Different Behavior
One of our strategies focuses on short- to medium-term dislocations within a single commodity curve. Think of it as trend following, breakout-driven but applied to pairs of contracts, with a lifespan naturally bounded by the expiry of the shorter leg.
This is related to what carry traders observe. But unlike carry, where stability and curve roll are rewarded, we seek dislocations, and benefit when the curve reshapes in a non-parallel fashion.
We run this type of strategy across energy, grains, softs, and metals. Copper serves as one of the most visible recent cases.
When Two Legs Break Rank
This chart shows the raw prices of two copper futures contracts:
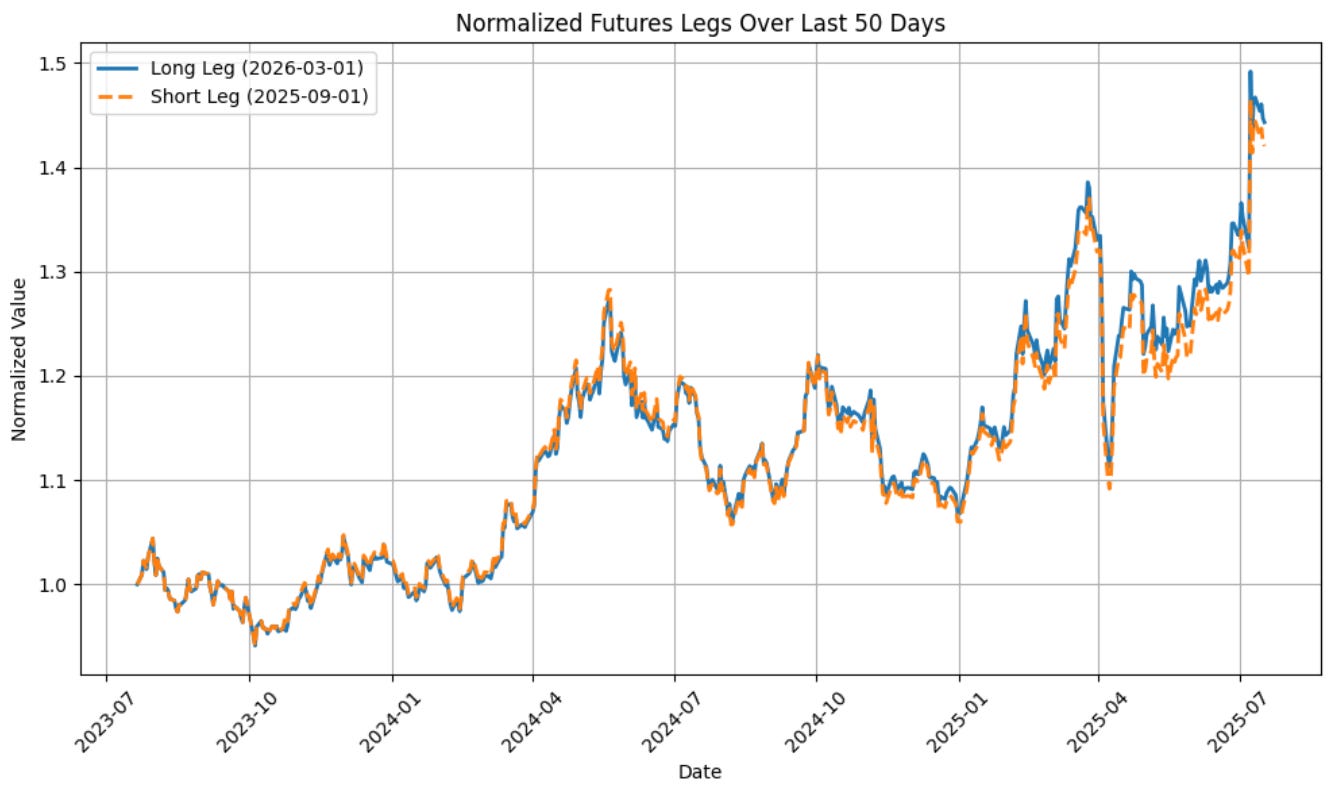
Short leg: September 2025 (U25)
Long leg: March 2026 (H26)
For most of their lifetime, these contracts traded in near-perfect lockstep, typical behavior for well-arbitraged points on a commodity curve.
But in April 2025, they began to diverge. As the U25 contract got closer to delivery, it became more sensitive to macro shocks, while the back end (H26) responded more slowly.
That divergence triggered one of our system’s signals. Not because of a headline, but because of how the curve rotated.
Copper Curve Rotation
We didn’t enter the trade on April 2, the day of the “Liberation Day” tariff announcement. That event created volatility across assets — including a sharp selloff and rebound in copper.
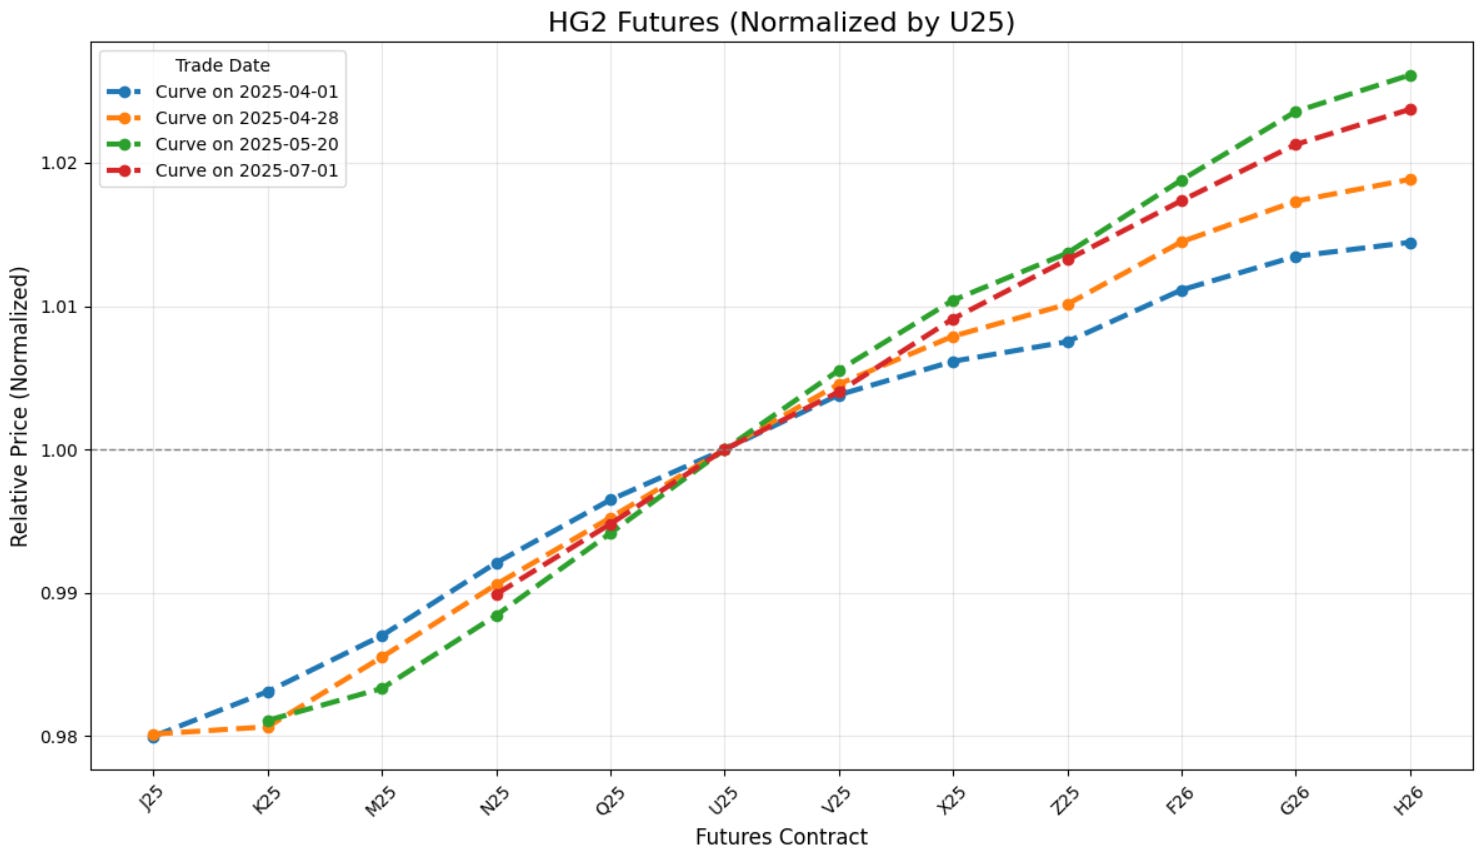
Instead, our system responded to what followed:
Between April 1 and April 28, the copper curve underwent a steepening. The front moved down and the back moved up.
U25 and V25 served as the hinge point, around which the curve rotated. In the above image we used the U25 contract as standardization to increase the visibility and because this month serves as our “anchor” point, being one of the legs in the spread trade.
By May 20, the spread had widened further.
By June 1, the curve began to flatten again — a slight reversal of the prior move.
This wasn’t about “price going up.” It was about shape, and the system was responding to the non-parallel reshaping of the curve.
Price vs. Spread — Same Market, Different Paths
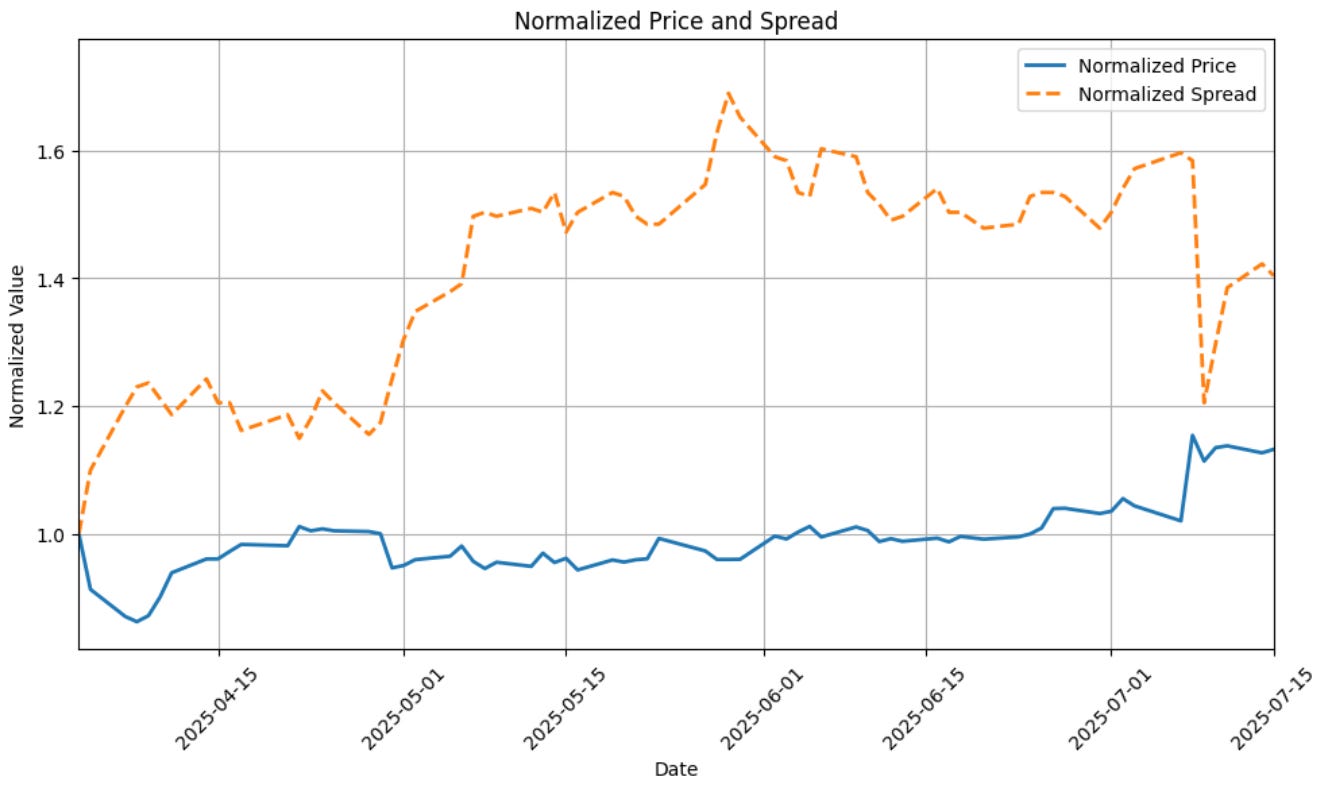
This chart compares:
Normalized front-month copper price.
Normalized spread (H26 – U25).
Both were trend trades, but behaved completely differently. In fact, the correlation between the two during this trade was –0.02.
This is key. Even though both positions came from trend systems on the same underlying, their behaviors were uncorrelated — a strong argument for integrating both styles into the same framework.
The Trump Tariff Shock — And a Snapback
In July, Trump proposed a 50% tariff on copper imports. This caused COMEX front-month futures to spike, while LME and SHFE contracts moved less or even declined.
For our position — short the nearer contract, long the back — this caused a temporary giveback, even though the trade had been profitable.
This kind of sharp reversal isn’t unusual. In many commodities:
Front contracts react more to geopolitical or macro news.
Back contracts move slower.
The result can be a snapback in the spread — but often short-lived.
Well-designed spread systems handle the heightened volatility or giveback risk it with proper sizing and exits.
Why Spread Trends Matter (For Us)
Spread trades:
Are finite-lived (bounded by contract expiries).
Are often entered mid-curve, not from inception.
Capture term structure dynamics, not just price.
Often behave differently than front-month trends.
Can deliver explosive breakouts — but also sharp reversals.
Importantly, they offer diversification inside a single market. That makes them a powerful complement to directional trend systems.
This type of curve rotation and dislocation happens across asset classes, be it diesel crack spreads in Europe, driven by refining constraints or agricultural curves, reshaped by weather, exports, and storage. Some even trade cross-commodity spreads like Arabica vs. Robusta, though we avoid that level of complexity and risk in our systems.
In each case, the shape of the curve is the signal, not just the level.
Performance in Context
We’re now 15 days up in a row, not due to a single position or prediction, but because we run a multi-dimensional framework that diversifies across assets, systems, and timeframes.
While trend benchmarks have struggled, for example, the NilssonHedge Systematic Momentum CTA Index is down –8.7% YTD. The same is true for another widely followed CTA index that we won’t name here (we’d rather not invite licensing fees… not on my watch).
We’ve found that combining directional trend, spread-based structures, and short-term momentum can offer resilience in dislocated and fast-changing markets.
These principles are currently reflected in our Global Quantitative Fund, where strategies like the spread trend breakout discussed here play an active role. Over time, we see potential for such approaches to complement the Global Markets Fund, which launched in June and is now accessible to U.S. investors.
If you're curious about our funds or want to understand how we think about trends, we’re always happy to have that conversation.
📩 Reach out to us at contact@takahe.capital
🌐 Visit takahe.capital
If this is the case are you trading convexity via flies then???
Thanks guys, very insightful.
Would be great if you could write about how the fund trades short-term momentum, and how it differs from trend.
Often when people say Momentum, they're talking about relative momentum, and trend being absolute momentum but definitions vary so I'm curious how you diversify it enough from Trend.