Bloomberg Is Making Stuff Up
Oil's wild ride is driven by an opaque group of algorithmic traders - or so they say
This morning I came across this Bloomberg article in which the authors, Devika Krishna Kumar and Julia Fanzeres, claim that a disruptive group of traders, namely trend following CTAs, have seized control of the oil market.
That’s quite a bold statement.
With a cup of coffee in one hand and my phone in the other, I posted some initial comments on LinkedIn here. I was about to move on with my day but somehow couldn’t get this article out of my head because it’s so loaded with factual errors. While we’re all used to one-sided, opinionated and agenda-driven articles, this piece really stands out - in a negative way.
Rather than lapsing into whataboutism and pointing out that systematic trend funds are neither disruptive nor opaque, I decided to have a closer look at some of the numbers they mentioned. So here we go:
Just in the past two months, prices threatened to reach $100 per barrel, only to whipsaw into the $70s. On one day in October, they swung as much as 6%. And so far in 2023, futures have lurched by more than $2 a day 161 times, a massive jump from previous years.
The authors sound as if a 30% move in oil, from $100 down to $70 over a period of two months, and a daily return of 6% were exceptional outliers.
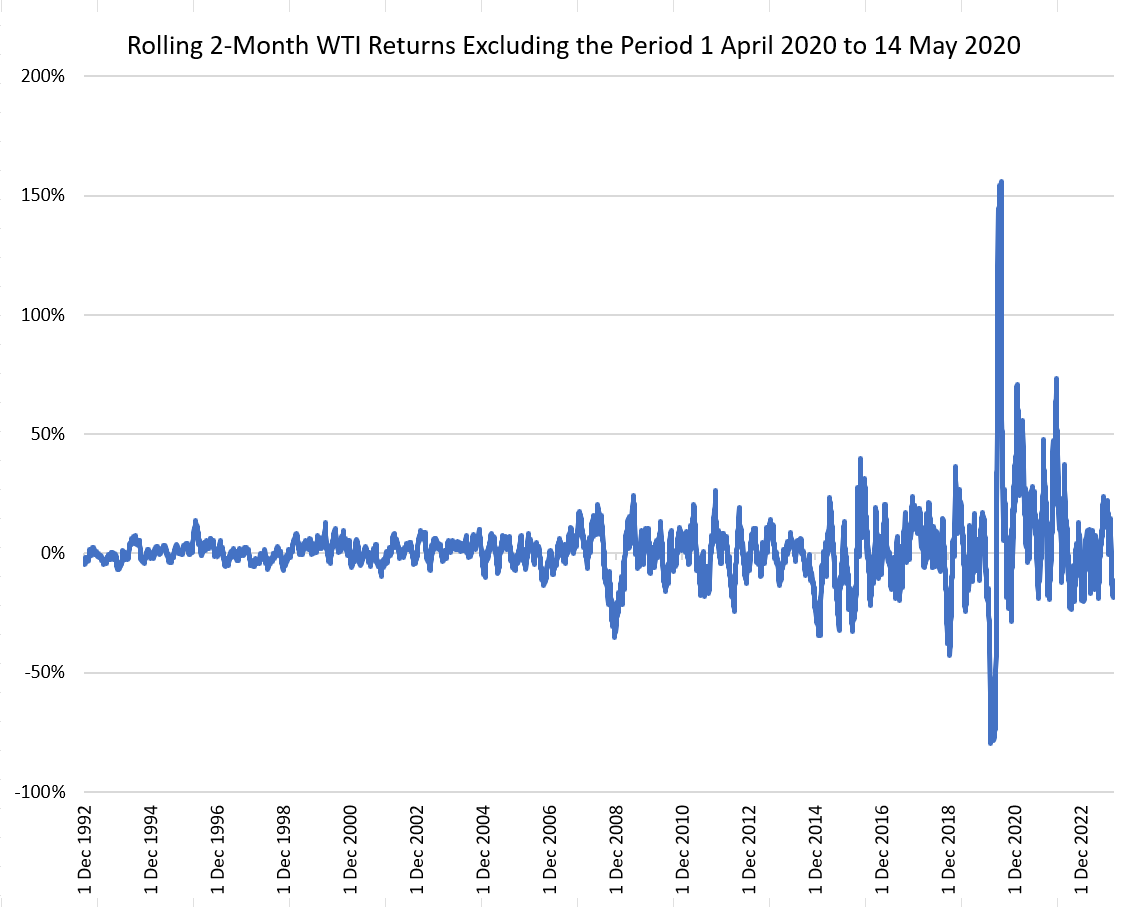
To check, I created a continuous front-month WTI crude oil futures time series using data from CSI, starting on 1 October 1992 and ending on 30 November 2023. The front contract is rolled 2 days prior to expiration. In my analysis, I removed the period 1 April 2020 to 14 May 2020 as this was when May 2020 contract went negative and, as you can imagine, the rolling 2-month returns during that period were far larger than +/- 30%.
The worst and best 2-month returns are -79.78% and 155.92%, respectively. More importantly than these two extremes, the dataset includes 112 rolling 2-month periods with returns worse than -30% and 163 with returns better than +30%.
Next up, the daily 6% move. Since 1 October 1992, the data include 49 daily moves of more than 6% and 60 of worse than -6%. The 6% daily return just isn’t an outlier. Instead, it’s something traders need to expect happening about 1-3 times every year on average.
I also checked the $2 move which they claim happened 161 times so far this year. On a settlement-to-settlement basis, we can see 24 moves of greater than $2 and 17 of worse than -$2. When we consider the daily range, i.e., high minus low, Bloomberg’s 161 number is correct. Let’s put this into perspective though. A (much) better way to look at this is with percentage returns rather than dollar-moves. A $2 move at this year’s average oil price of $76 equates to a +/- 2.63% return. This isn’t unusual at all. In fact, a worse than -2.63% return has happened 398 times, or in about 5% of all cases, which means you should expect it to happen once every 20 business days. It’s about the same frequency for a +2.63% return, so again: nothing out of the ordinary.
In 2022, when CTA trading volumes rapidly expanded, New York oil futures posted a more-than $2 daily move 242 times. That’s 150% higher than the historical average since 2000, according to Bloomberg calculations.
Bloomberg’s statement above is correct, and worthless at the same time. When using percentages rather than dollar changes, then — statistically — the year 2022 looks like any other year in WTI crude oil.
Anyway, move on. Nothing to see here, except very bad journalism of course. I thought I should point it out.
Moritz


