
2026: Looking Ahead
Santa Rally or Hangover, what is 2025 nursing?

I know, I know. I distinctly recall signing off until 2026 in my last note. But quiet days without active trading have a funny way of sparking ideas, and frankly, this one was too good to leave gathering dust until January. So, consider this a bonus round. I’ll keep sending these out until I run out of holiday boredom (don’t worry, the next one really will be in 2026).
I’ve been seeing a flurry of “2026 Predictions” lately, specifically calling for the end of the recent rally in precious metals. Yesterday’s dip certainly added fuel to that fire, though as I write this, we’ve already seen a decent recovery. Regardless of the noise, we are likely heading into the new year with a solid +4-5% month for the Global Markets Fund, capping off an already stellar year with one final bang.
But back to the question at hand. As we pop the champagne and prepare to welcome 2026, every trading desk is buzzing with the same query: “Will the trends of the last few weeks actually survive the ball drop?”
You know the drill. Everyone loves to talk about the Santa Claus Rally, that magical window where stocks supposedly float higher on a cushion of holiday optimism, retail bonuses, and thin volume. But as curious trend followers (who prefer cold data over warm folklore), we wondered: Does Santa only visit the Stock Exchange? Or does he also stop by the Bond desk and the Commodity pits?
So, purely for intellectual sport, and please take this with a massive grain of salt, as this is an exercise in small sample statistics, we decided to stress-test this “holiday momentum” theory on the heavy hitters: the major indices, commodities, and bonds that actually drive the macro narrative.
Here is what the numbers actually say.
A Snapshot of History
First, we pulled data for some of the assets everyone is watching, from the S&P 500 to Gold, Oil, and the Euro. The table below tracks three key performance windows for each year:
Last 10 Days: The trend into year-end.
Subseq Jan: What happened immediately after.
Subseq Year: The full year follow-through.
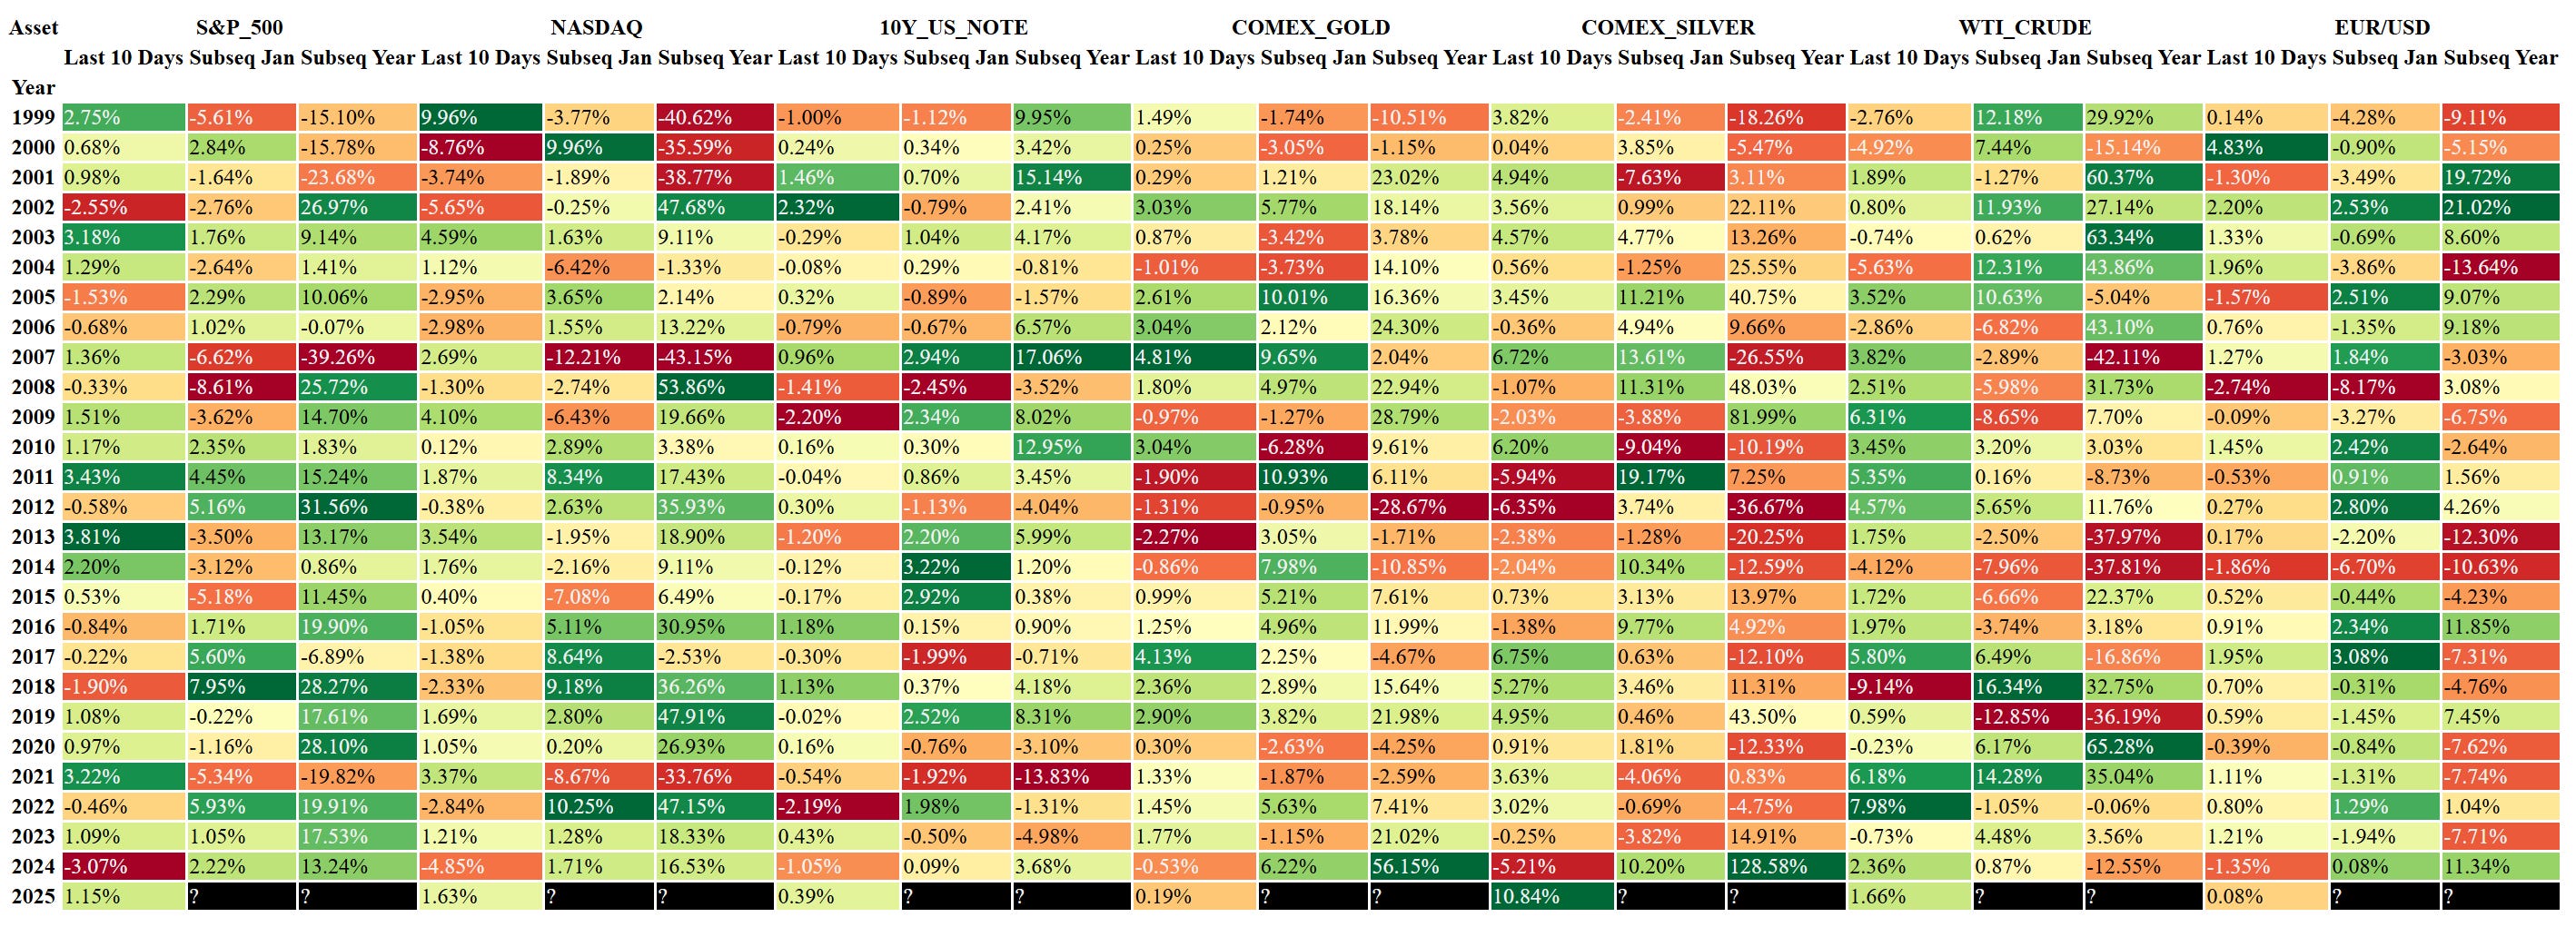
First Impression: Honestly? It’s a bit of an optical illusion. If you can spot a clear, consistent pattern just by staring at that grid, your eyes are better than ours. It seems the market is a bit more complex than a simple calendar flip.
The “Hobby Forecaster” Stats: Santa vs. The Hangover
Now for the fun part. We crunched the stats to see how often momentum actually persists. We calculated the Direction Match (Jan), simply put, how often does a green December lead to a green January?
If the “Santa Rally” were a reliable momentum signal, we’d expect high correlations and matches well above 50%. For most Equities, we found the exact opposite.
The Equity “Hangover”
Take a close look at the data for the major indices. If the “Santa Rally” were a reliable momentum signal, we would expect to see a Direction Match well above 50%, meaning a green December usually leads to a green January.
Instead, we see a lot of reversals.
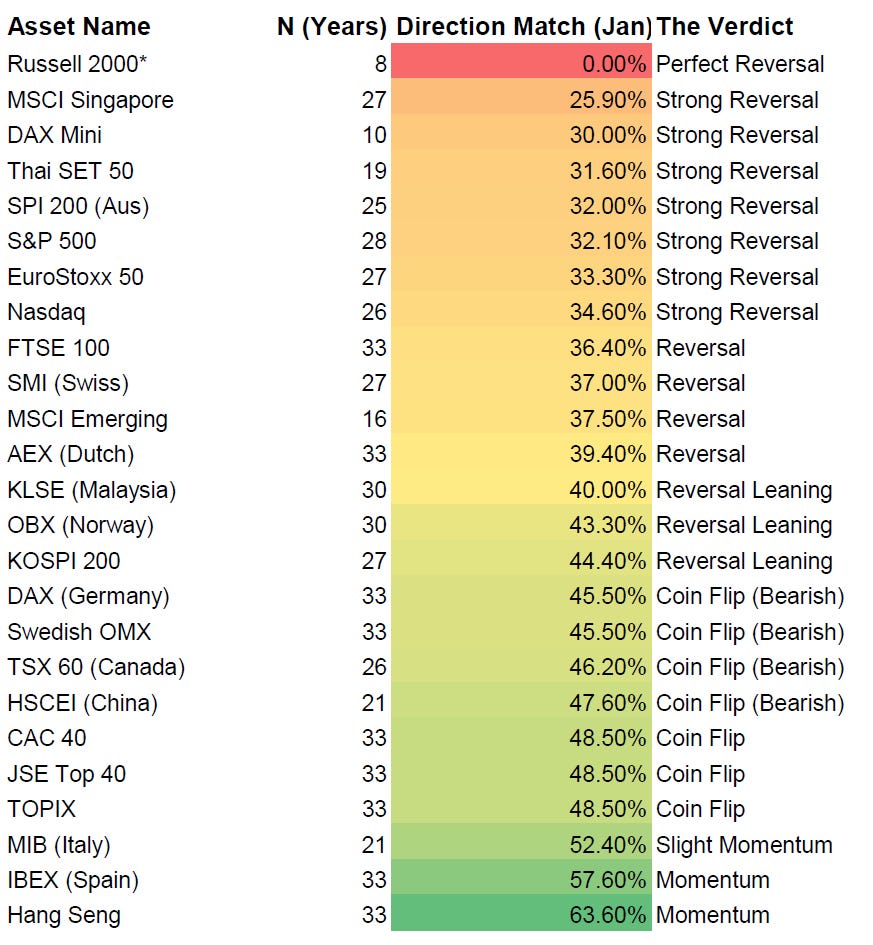
(Note: The Russell 2000 data reflects the specific RTY contract era since 2017. While the sample is small, the signal has been flawless: 8 years, 0 matches. A perfect contrarian indicator?)
What is going on here? The data strongly supports the "Window Dressing" theory. Fund managers bid up the year's "winners" in late December to make their annual reports look attractive. As soon as the calendar flips to January 1st, that artificial buying pressure evaporates, and the market reverses.
For the Academics: This isn't just a hunch. David Musto’s seminal paper “Portfolio Disclosures and Year-End Price Shifts” (Journal of Finance, 1997) documented this phenomenon. He found that year-end price distortions caused by disclosure incentives systematically reverse in the new year.
Only a handful of markets (Spain, Italy, Hong Kong) buck the trend. For the rest of the world, especially the US, UK, and Asia-Pacific, January is predominantly a month of unwinding the December party.
The 2025 Finish Line: Checking Our Watchlist
Finally, let’s separate the signal from the noise. Instead of scanning the entire universe for random outliers, let’s circle back to the heavy hitters, the assets that actually drive the macro narrative.
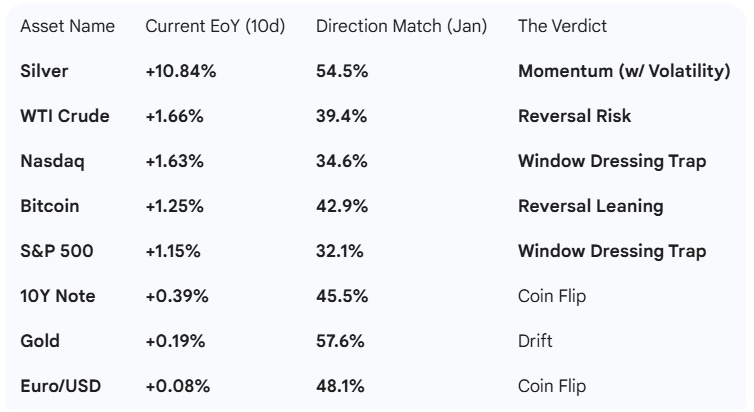
We looked at where the S&P 500, Nasdaq, Gold, Silver, Oil, and Bitcoin are trading right now (Last 10 Days) and compared that to their historical probability of continuing that trend in January.
Here is the scorecard for the major macro assets as we close out 2025:
How to read this:
The “Window Dressing” Trap: Look at the Equities. The Nasdaq (+1.63%) and S&P 500 (+1.15%) are enjoying a nice holiday pump. But look at the history: with Direction Matches of ~32-34%, history screams that this is likely artificial buying. The probability favors a reversal, not a continuation.
The “Real” Momentum: Gold and Silver boast the highest continuation probabilities in our list. However, if we look closer at those assets in our first table, we see that there is some serious volatility in returns following positive short-term momentum in Silver, and Gold was often lackluster in January (great that we have both in the portfolio, right?).
Final Thought
So, if you see a massive rally in your favorite asset right now, should you FOMO in? Or should you fade it because history hints at a reversal?
Here is the liberating truth: We don’t care.
These stats are fun for a year-end deep dive, but they aren’t a trading strategy. Our core mantra remains untouched: We are trend followers. We don’t predict “Santa Rallies” or “January Hangovers.” We don’t ask why the price is moving or what the calendar says. We simply ask where it is going and we follow. We get out if it turns against us.
If the trend rides into 2026, we’ll be on it. If it runs into our risk limits on Jan 2nd, we’ll be out. The calendar changes, but the strategy doesn’t.
Happy New Year! See you in 2026! 🥂